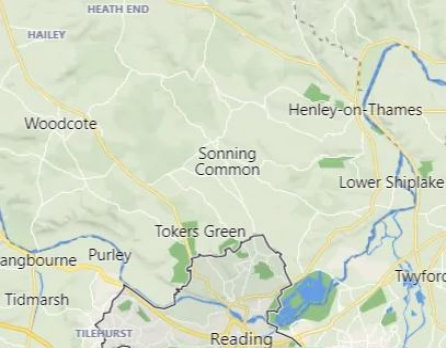
Sonning Common
Weather Station Data Records
Nuclear Radiation Log
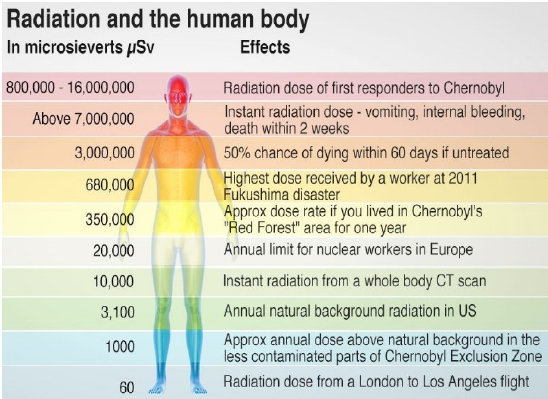
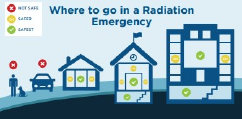
Nuclear Radiation uSv/h Level Guidlines
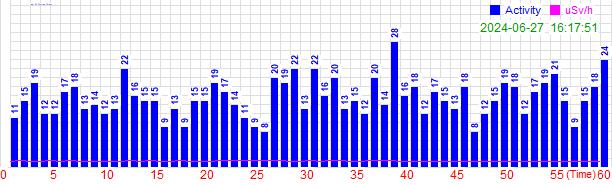
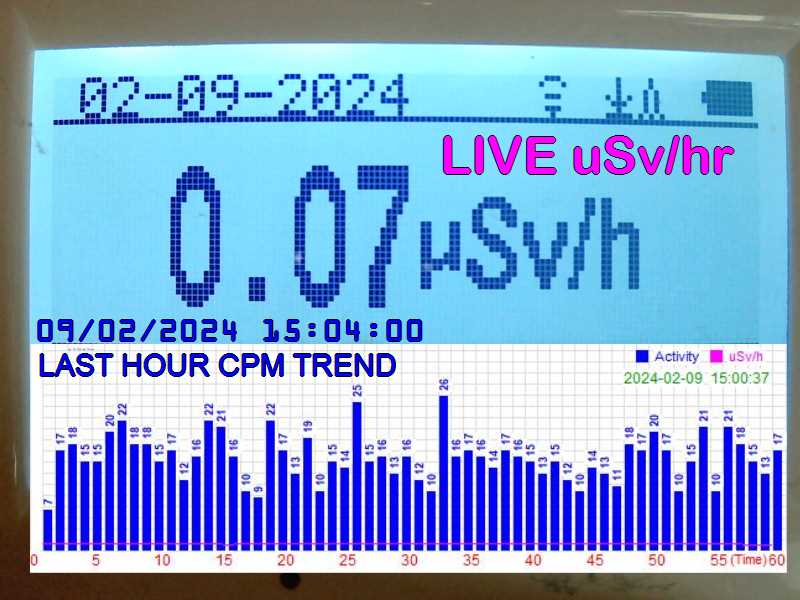
-Live CPM + uSv/hr Geiger Counts indoors every Minute-
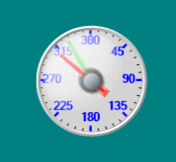
Current uSv/hr
+(Current CPM)
+(Current mR/h)
( <0.33 = normal background )
"LIVE"
0.33 - 0.65 (Medium) - Keep Monitoring
>0.65 (High) - Find out why? (See World CPM Map)
>13.0 (Dangerous) - Evacuate / Shelter Immediately
>6.5 (Very High) - Leave / Relocate ASAP
(Last Hour: 'Refresh' for latest)
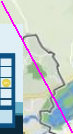
Scandinavia/Russia
Central Europe
Southern Europe
Atlantic Ocean
Atlantic Ocean
(CPM = Counts per Minute)
(Average uSv/Hr per Minute)